By B. C. Dodrill, Senior Scientist • Lake Shore Cryotronics
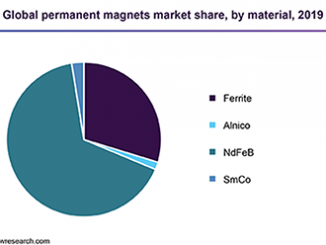
Magnetically hard ferrite powders are widely used, due to their low-cost production and good performance in many electronic devices such as electrical motors, speakers and recording media. Usually ferrites are single-phase magnets but when the stoichiometry is not precise or the fabrication process is not adequate, the ferritic phase may be accompanied by other phases that promote magnetic interactions, which results in a decrease of the magnetic performance of the magnet. Additionally, there is currently strong interest in exchange spring magnets, which are comprised of a hard high coercivity phase exchange coupled to a soft high saturation magnetization phase, as this leads to a magnet with increased energy density. This results in reduced costs because less hard phase material is required. Other examples of multi-phase magnets include nanostructures, such as soft shell/hard core nanowires, hybrid magnets, etc.
 The magnetic characterization of such materials is usually made by measuring a hysteresis loop. However, it is very difficult to unravel the complex magnetic signatures of multi-phase magnets, or to obtain information of interactions or coercivity distributions from the hysteresis loop alone. First-order-reversal-curves (FORC) provide a means for determining the distribution of switching and interaction fields between magnetic particles, and for distinguishing between magnetic phases in composite materials that contain more than one magnetic phase. In this article, we will discuss the FORC measurement and analysis technique, and present results for various ferrite multi-phase composites.
 Magnetization Measurements & First-Order-Reversal-Curves
The most common measurement that is performed to characterize a materials magnetic properties is measurement of the major hysteresis or M(H) loop. The parameters that are usually extracted from the M(H) loop are illustrated in Figure 1 and include: the saturation magnetization Msat (the magnetization at maximum applied field), the remanence Mrem (the magnetization at zero applied field after applying a saturating field), and the coercivity Hc (the field required to demagnetize the material). For permanent magnet materials, the maximum energy product BHmax, which is determined from the second quadrant demagnetization curve, is also commonly of interest. Note that the measured coercivity Hc is the average coercivity (or average distribution of switching fields) of the entire ensemble of magnetic particles that constitute a magnetic material.
 More complex magnetization curves covering states with field and magnetization values located inside the major hysteresis loop, such as first-order-reversal-curves (FORC)[1], can give information that is not possible to obtain from the hysteresis loop alone. These curves include the distribution of switching and interaction fields, and differentiation of multiple phases in composite or hybrid materials containing more than one phase. A FORC is measured by saturating a sample in a field Hsat, decreasing the field to a reversal field Ha, then sweeping the field back to Hsat in a series of regular field steps Hb. This process is repeated for many values of Ha, yielding a series of FORCs. This is illustrated in Figure 2. The measured magnetization at each step as a function of Ha and Hb gives M(Ha, Hb), which is then plotted as a function of Ha and Hb in field space. The FORC distribution ρ(Ha, Hb) is the mixed second derivative, i.e., ρ(Ha, Hb) = -∂2 M(Ha, Hb)/ ∂Ha∂Hb.
The FORC diagram is a 2-D or 3-D contour plot of ρ(Ha, Hb) with the axis rotated by changing coordinates from (Ha, Hb) to Hc = (Hb – Ha)/2 and Hu = (Hb + Ha)/2, as illustrated in Figure 3, where Hu represents the distribution of interaction fields, and Hc represents the distribution of switching fields.
 FORC Results for Multi-Phase Ferrite Magnets
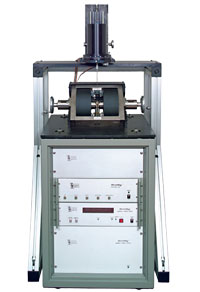
To demonstrate the utility of FORC analysis for differentiating multiple phase materials, multi-phase composites were synthetically produced by mixing together single-phase magnets including: Sr-ferrite powder, BaFe2O4 ceramic, and BaFe2O4 and γ-Fe2O3 magnetic recording tapes. All magnetic measurements were performed at ambient temperature using a Lake Shore Cryotronics MicroMag Vibrating Sample Magnetometer (VSM). There are a number of open source FORC analysis software packages such as FORCinel[3], although in this article custom analysis software was used to calculate the FORC distributions.
Figure 4 and Figure 5 show the measured hysteresis M(H) loop and FORCs for a sample consisting of a mixture of Sr-ferrite powder and BaFe2O4 ceramic. The coercivities for each sample as determined from their individual M(H) loops were 1 kOe and 3 kOe, respectively. The coercivity for the mixed sample is 2.3 kOe and there is no clear evidence of multi-phase behavior from the M(H) loop results shown in Figure 4.
Figure 6 shows the 2-D FORC diagram for the mixture of Sr-ferrite powder and BaFe2O4 ceramic. There are two peaks in the distribution centered at 1 kOe and 3 kOe corresponding to the Sr-ferrite powder and BaFe2O4 ceramic, respectively.
Figure 7 shows the individual and combined M(H) loops for a synthetically produced 3-phase sample, consisting of a BaFe2O4 ceramic, and BaFe2O4 (MT1) and γ-Fe2O3 (MT2) magnetic recording tapes with individual coercivities (as determined from the individual M(H) loops) of 2 kOe, 789 Oe and 233 Oe, respectively. Note that the M(H) loop for the mixture of all three samples is very similar to the hysteresis loop for the BaFe2O4 ceramic sample alone, and is devoid of any indication of multi-phase behavior.

Figure 8 and Figure 9 show the measured FORCs and 2-D FORC diagram, respectively, for the mixture of all three samples. There are three peaks in the distribution centered at the coercivities corresponding to each individual sample.
Conclusions
FORC analysis is indispensable for characterizing interactions and coercivity distributions in a wide array of magnetic materials including: nanomagnets[2], permanent magnets[4], exchange-coupled magnetic multilayers[5], and geomagnetic and geological samples[6]. In this article, we have shown that FORC also provides a means for distinguishing between magnetic phases in composite materials that contain more than one magnetic phase.
References
- C.R. Pike, A.P. Roberts, K.L. Verosub, “Characterizing interactions in fine particle systems using first order reversal curves”, Journal of Applied Physics, 85, 6660, 1999.
- B. C. Dodrill, L. Spinu, “First Order Reversal Curve Analysis of Nanoscale Magnetic Materials”, Technical Proceedings of the 2014 NSTI Nanotechnology Conference, CRC Press, June 2014.
- R. J. Harrison and J. M. Feinberg, “FORCinel: An improved algorithm for calculating first-order reversal curve distributions using locally weighted regression smoothing”, Geochemisty, Geophysics, Geosystems, 9, 11, 2008. FORCinel may be downloaded from: https://wserv4.esc.cam.ac.uk/nanopaleomag/?page_id=31.
- B. C. Dodrill, “FORC Analysis of Permanent Magnet Materials”, Lake Shore Application Note (and references contained therein).
- B. C. Dodrill, L. Spinu, “FORC Analysis of Exchange Bias Magnetic Multilayer Films”, Lake Shore Application Note (and references contained therein).
- A. R. Muxworthy, A. P. Roberts, “First-Order-Reversal-Curve (FORC) Diagrams”, Encyclopedia of Geomagnetism and Paleomagnetism, Springer, 2007.
 About the Author
Brad C. Dodrill graduated from The Ohio State University in 1982 with a BSc degree in Physics and a minor in Mathematics. He completed 2 years of graduate studies in Physics and Electrical Engineering and took a position with Lake Shore Cryotronics in 1984 as a Research Scientist. He is presently the Vice President of Sales and a Senior Scientist at Lake Shore. In his technical capacity he is active in applications and product development initiatives in the areas of magnetic and electronic measurements and materials. He has 32 paper publications to his credit, holds 3 US patents, and has lectured at technical conferences and numerous universities in the US, Europe and Asia on Vibrating Sample Magnetometry, AC Susceptometry and other magnetic measurement techniques.
For more information visit www.lakeshore.com
1 Trackback / Pingback
Comments are closed.